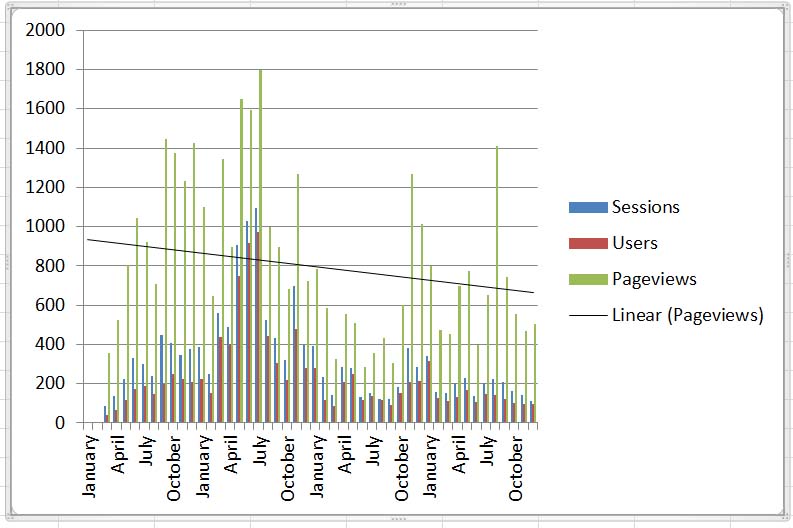
For each of the four (4!) years I have been blogging, I have posted a fairly geeky post about my progress and numbers.It’s something I look forward to, and it helps me get an idea of what the next year might look like.
Posts and Other Numbers
| 2014 | 2015 | 2016 | 2017 | |
| Posts | 158 | 124 | 71 | 64 |
| Sessions | 2899 | 7081 | 2700 | 2277 |
| Users | 1262 | 5108 | 1691 | 1334 |
| Page Views | 9790 | 13586 | 7009 | 7925 |
Yes, the number of posts has fallen each year. I’m going to think about that some in a future post about goals. But, one a week is still not too shabby.
I find it interesting that the “users” data dropped off so steeply in 2016, which (I hear) is the year that Facebook changed its programming to get people to pay for posts.
Data Trends

Google Analytics
2017
 2016
2016
 2015
2015
 2014
2014

Most popular posts (by month, 2017)
January 13 – An inauspicious start
February 21 – Scent of Season
March 13 – Other opinions are “Out There”
April 20 – Goodbye, Finn
May 19 – What we share
June 17 – Among the roses
July 18 – Workshop accomplished
August 16 – The trouble with being human
September 17 – Montana adventure – days 1 and 2
October 15 – The extra bedroom
November 12 – Bev Jozwiak Workshop – Day 1
December 10 – Pelagic Tour (On the Open Sea)
Conclusion
My next post will be about how I did on my 2017 goals. After that, it’ll be 2018 with a list of new goals. I’ll be taking the information about into account.

